Failing In So Many Ways

Icon

Liang Nuren – Failing In So Many Ways

Vim Usage

One thing that I’ve noticed about many vim users is that they develop habits in a vacuum from other experienced vim users – something that tends to lead to highly inefficient setups for editing code.  Here’s a few simple changes that I’ve seen that can make everyone’s lives much easier.  First, I highly recommend reading up on the vimrc – a configuration file that tells vim to do many things for you automatically.  Second, I highly recommend looking into various vim builtins and plugins to automate even more things.

Ctags

Ctags [sf.net] is not specifically a plugin to vim – it’s an external application which scans a source tree and finds source objects (classes, functions, variables, etc).  From there it creates a master file which contains an index of where all of these things are defined.  This allows you to do something like move the cursor over a particular object and ^], which will take you directly to the definition of the object.  Occasionally, ^] will not take you to the correct place – which is where :tnext and :tlist come in.  There are also plugins like TagList [vim.org] which I’m not going to cover which help out here.

Possibly the best thing about ctags is that it enables extremely fast location of source functions even across mixed language source trees – such as with Python, Java, PL/SQL, and various UDFs.  While this is primarily a manner of finding out what a method does or what an object is, it also doubles as loading the file in a buffer for extending vim’s builtin autocomplete (covered below).

In order to enable ctags you’ll need to add a line to your vimrc which looks something like this:

set tag <directory>/tags

You may also need to change the tag file if you change trees or projects.  That looks like “:set tag <new_directory>/tags”

Autocomplete

Vim comes built in with autocomplete, and it’s accessible via ^p and ^P.  By default, it searches files which are currently open in a buffer (including the current file) – so it builds nicely on ctags and long lived multi file vim sessions.  The built in autocomplete is the kind of textual autocomplete that helps avoid typos and makes typing longer variable names much faster.  It’s not the kind of intellisense given by the YouCompleteMe plugin below.  However, it does mean that autocomplete is very fast and works everywhere from source editing to writing documentation – so it’s still a huge help.

Vundle

Vundle [github.com] is a vim plugin manager, and I think it’s one of the cleanest ways to install and use plugins in vim.  Once you’ve added a bundle to your vimrc, :BundleInstall will make it active in your current (and all future) vim sessions.  If a plugin causes you grief or doesn’t work out for you, it’s pretty easy to deactivate it by commenting it yout in your ~/.vimrc.

BufExplorer

Buffer Explorer [vim.org] is a plugin that gives you a view into the files and buffers that you have open.  In a lot of ways it works just like having a bunch of tabs to files all over the project in a generic IDE.  Again, this builds nicely on top of ctags and autocomplete to provide a framework to easily move between already open files.  Another thing that this gives you is the ability to easy copy and paste things between buffers.

For the most part, this plugin is manipulated via the following commands:

  • :e <some file name> # opens the file in a new buffer
  • :e . # opens an explorer for the current directory in a new buffer
  • \be # opens up the explorer for the buffers currently available. Navigate with standard vim navigation (hjkl, arrows, or mouse).  Enter selects the currently selected buffer.

I also highly recommend putting the following line in your ~/.vimrc to allow you to change between files without having saved them first.

set hidden

VisIncr

This plugin [vim.org] takes columns of numbers or dates and increments them.  The idea is that you ^v and select a column of text and increment every value in it.  This is primarily useful for setting up test data, and plays into why I like the Align plugin below.  A typical interaction with this plugin is as follows:

  • See a column of numbers or dates
  • ^v and highlight the column of numbers
  • :II (to increment the numbers by an implicit 1 – :II2 would have incremented by 2s!)

Align

This plugin [vim.org] is a taste plugin.  I like being able to visually look down a line of things (such as in a JSON dictionary) and see the keys on one side of a line and values on the other.  This script helps automate pretty much that entire process.   My typical interactions with this plugin are via key bindings which are available in my ~/.vimrc.  However, you can align a block of equal signs by highlighting at and :Align =

I’ve copied them here for reference:

map ,as :Align! =W \<AS\><CR>
map ,a= :Align! =W =+<CR>
map ,a: :Align! =W [:]\+<CR>

YouCompleteMe

This plugin [github.com] requires a little bit of setup and may not work on certain esoteric operating systems, however if you’re running on a modern operating system like OSX, Linux, or Windows it will give you great intellisense style autocomplete for pretty much every language possible.  The autocomplete works automatically as you type and access packages or member variables.  It should also be available through the standard ^p/^P channel as well.  If you end up using ^p/^P, it will often open a small buffer at the top of the screen with the function prototype, which can sometimes be quite helpful.  You’ll probably want to use :on[ly] to get rid of the extra window at the top when you’re done with it.

Every once in a while there’ll be a language (Python, for example) which has great autocomplete if you could only setup the PYTHONPATH for where your’e currently working.  This can be done before launching vim or via “let $PYTHONPATH=<directory>:$PYTHONPATH”.

As a note, Java/Groovy/Scala autocomplete will likely require eclim [eclim.org], and isn’t covered here.

Syntastic

Syntastic [github.com] is a plugin that helps you with syntax errors.  If you goof and write some bad syntax, it’ll tell you right on the screen what and where your error was.  I highly recommend turning off the syntactic python checkers if the company style guide violates pep8, because they try to run pyflakes and pep8.  Still, it’s pretty fantastic for seeing malformed syntax in whatever language you’re trying to work in – and in whatever style.

vim-indent-guides

I’ve sometimes found it painful to visually look at code that’s not indented enough (say, two spaces).  However, as with all things, VIM has plugins that will come to the rescue.  The vim-indent-guides [github.com] plugin is enabled and disabled with \ig.  It colors the backgrounds in vertical slices and allows you to really easily see where things are going.

Your ~/.vimrc

This is a useful snippet for helping follow the usual Python style guides (goes in your .vimrc):

set nocompatible        " No, don't use vi mode
set number              " Line numbers on the screen
set backspace=2         " (bs) allow backspacing over everything in insert mode
set hidden              " Bufexlorer stops whining about the current file being unsaved
set history=50          " (hi) keep 50 lines of command line history
set hlsearch            " Highlight my current search term
set incsearch           " Start searching while I type
set mouse=a             " Use the mouse on the terminal
set pastetoggle=<F12>   " Toggle !paste with a key press - mostly so that autoindent doesn't interfere
set ruler               " (ru) show the cursor position all the time
set showcmd             " 
set showmatch           " Do paren matching as I move over them
set laststatus=2        " I always want a status line
set statusline=[%n]\ %F\ %(\ %M%R%H)%)\ \@(%l\,%c%V)\ %P
set textwidth=0         " Don't word wrap automatically
set wrap                " But do continue long lines on the next line
set vb t_vb=            " No bells
set viminfo='20,\"50,%  " (vi) read/write a .viminfo file, don't store more than 50 lines of registers
set autoindent          " Indent is for the win
set ts=8                " Tabs and I don't get along, so make them obviously huge
set softtabstop=4       " use soft tabs are 4 spaces
set shiftwidth=4        " use soft tabs are 4 spaces
set expandtab           " use soft tabs are 4 spaces
set scrolloff=5         " Syntax highlighting reset
set autoread            " Reload files that have changed

autocmd BufEnter,BufRead,BufNewFile *       lcd %:p:h                                " Always chdir to the current directory with a file.  Helps with relative paths
autocmd BufEnter,BufRead,BufNewFile *       syntax sync fromstart                    " Syntax highlight from the beginning of a file (helps with long string blocks)
autocmd BufEnter,BufRead,BufNewFile *       set softtabstop=4 shiftwidth=4 expandtab " Setup 4 space soft tabs no matter what
autocmd BufEnter,BufRead,BufNewFile *.scala set filetype=scala                       " Set filetype scala for all scala files

" Kills wailing tritespace
map ,wt :perldo s/\s+$//g<CR>:perldo s/\t/    /g<CR>

" Make Eclim and YouCompleteMe play nice
let g:EclimCompletionMethod = 'omnifunc'

" Find and display overly long lines
highlight OverLength ctermbg=red ctermfg=white guibg=#592929
match OverLength /\%121v.\+/

" Modify python filetype autoindent to be less annoying.
let g:pyindent_open_paren        = '&sw'
let g:pyindent_nested_paren      = '&sw'
let g:pyindent_continue          = '&sw'
let python_space_error_highlight = 1

I’m more than happy to pair with anyone to show how all of this works together in person (or perhaps via a youtube video or projector).  Feel free to ask me any questions about how to make your vim workflow better. 🙂

Filed under: Software Development, ,

Python and Pypy, Pyscopg2 vs Psycopg2cffi

I’ve been using Python with psycopg2 [init.d] pretty much full time for a couple of years now.  However, today I was browsing through the documentation and realized that I didn’t know the performance penalty for various operations and cursor factories.  I’ve traditionally assumed that the default tuple based cursor must have a pretty significant performance benefit to make up for its lack of features, but I the performance penalty for DictCursor didn’t feel all that bad so I’ve just rolled with it.

Another habit I’ve taken up recently was attempting to get processing underway sooner while minimizing the memory footprint.  This means in a lot of applications I’ve taken to avoiding cursor.fetchall() in favor of iteratively fetching from the cursor.  I also didn’t have a quantitative measurement for the performance impact of this.  For the curious, the approach looks something like this (check below for the gist):

with conn.cursor() as cur:
    for row in cur:
        do_something(row)

So today at work I resolved that I’d spend my Bart ride home writing a quick benchmark to test various interesting cursor factories as well as fetchall() vs [ x for x in cursor ].  Once the testing got underway I realized that I could run the same code to test the new psycopg2cffi module as well as pypy-2.0.2 (with psycopg2cffi).  These are the results for fetching 10000 rows with 8 columns 1000 times on my computer:

# 1k calls, cume duration
# 10k rows fetched
# +--------------------+----------------+--------------------+-------------------------+
# |   Default Cursor   | psycopg2/2.7.3 | psycopg2cffi/2.7.3 | psycopg2cffi/pypy-2.0.2 |
# +====================+================+====================+=========================+
# | fetch_results      | 18.072         | 18.076             | 32.817                  |
# +--------------------+----------------+--------------------+-------------------------+
# | fetch_iter_results | 20.560         | 20.691             | 33.817                  |
# +--------------------+----------------+--------------------+-------------------------+
# 
# +--------------------+----------------+--------------------+-------------------------+
# |     DictCursor     | psycopg2/2.7.3 | psycopg2cffi/2.7.3 | psycopg2cffi/pypy-2.0.2 |
# +====================+================+====================+=========================+
# | fetch_results      | 18.405         | 18.377             | 32.434                  |
# +--------------------+----------------+--------------------+-------------------------+
# | fetch_iter_results | 19.563         | 19.674             | 33.265                  |
# +--------------------+----------------+--------------------+-------------------------+
# 
# +--------------------+----------------+--------------------+-------------------------+
# |  NamedTupleCursor  | psycopg2/2.7.3 | psycopg2cffi/2.7.3 | psycopg2cffi/pypy-2.0.2 |
# +====================+================+====================+=========================+
# | fetch_results      | 18.296         | 18.291             | 32.158                  |
# +--------------------+----------------+--------------------+-------------------------+
# | fetch_iter_results | 19.599         | 19.650             | 32.999                  |
# +--------------------+----------------+--------------------+-------------------------+

The thing that surprised me most about these results was that iterating across the cursor wasn’t really that much more expensive than fetchall.  I suspect that the cost increases with increased network latency, but at least some of that cost will be paid with fetchall as well.   I think it’s a good idea to set up a more rigorous benchmark before saying it’s “low cost”, but either way I really appreciate the ability to start operating on a smaller dataset while keeping the memory footprint low.

I was also pretty surprised by how little of a performance penalty DictCursor and NamedTupleCursor had.  It probably shouldn’t surprise me much considering network latency and data transfer absolutely should trivialize object creation costs.  I guess the take away from this is: if you’re going to go through all the effort of going to the database to get a piece of data, make sure you return it in a way that makes sense and is convenient to manipulate.

I was, unfortunately, not terribly surprised by Pypy’s poor performance here.  Whiel this application is ostensibly a tight loop pulling from the database and creating objects, it doesn’t feel like it plays to what I think are Pypy’s  best strengths.  I’ve had my best luck using Pypy to run specialized applications that spend most of their time in tight computation loops.

For the curious, the benchmarking file is here (along with the above chart).

Filed under: Data Warehousing, Software Development, , , ,

DAU Decomp

So I was recently chatting with @AngryFacing on Twitter about whether or not it’s worth supporting IOS4 anymore.  I told him I was pretty sure the IOS4 rate is very low and obtained permission from a VP at my studio to publish some (anonymized) numbers for a couple of our games.  Here’s what I found (model map from http://theiphonewiki.com/wiki/Models)

Game 1

       period        |  os   | pct  
---------------------+-------+------
 2013-07-01 00:00:00 | iOS 6 | 0.91
 2013-07-01 00:00:00 | iOS 5 | 0.08
 2013-07-01 00:00:00 | iOS 7 | 0.00
 2013-07-01 00:00:00 | iOS 4 | 0.00

       period        |    name    | pct  
---------------------+------------+------
 2013-07-01 00:00:00 | iPad 2     | 0.22
 2013-07-01 00:00:00 | iPhone 4   | 0.19
 2013-07-01 00:00:00 | iPhone 4S  | 0.14
 2013-07-01 00:00:00 | iPhone 5   | 0.12
 2013-07-01 00:00:00 | iPad 3     | 0.09
 2013-07-01 00:00:00 | iPad Mini  | 0.07
 2013-07-01 00:00:00 | iPad 4     | 0.07
 2013-07-01 00:00:00 | iPad 1G    | 0.02
 2013-07-01 00:00:00 | iPhone 3GS | 0.00

Game 2:

       period        |   os   | pct  
---------------------+--------+------
 2013-07-01 00:00:00 | iOS 6  | 0.90
 2013-07-01 00:00:00 | iOS 5  | 0.09
 2013-07-01 00:00:00 | iOS 7  | 0.00

       period        |    name    | pct  
---------------------+------------+------
 2013-07-01 00:00:00 | iPad 2     | 0.25
 2013-07-01 00:00:00 | iPhone 4   | 0.21
 2013-07-01 00:00:00 | iPhone 5   | 0.14
 2013-07-01 00:00:00 | iPhone 4S  | 0.13
 2013-07-01 00:00:00 | iPad 3     | 0.10
 2013-07-01 00:00:00 | iPad Mini  | 0.08
 2013-07-01 00:00:00 | iPad 4     | 0.08
 2013-07-01 00:00:00 | iPad 1G    | 0.00
 2013-07-01 00:00:00 | iPhone 3GS | 0.00

Game 3:

       period        |  os   | pct  
---------------------+-------+------
 2013-07-01 00:00:00 | iOS 6 | 0.94
 2013-07-01 00:00:00 | iOS 5 | 0.04
 2013-07-01 00:00:00 | iOS 7 | 0.00

       period        |    name    | pct  
---------------------+------------+------
 2013-07-01 00:00:00 | iPad 2     | 0.24
 2013-07-01 00:00:00 | iPhone 4   | 0.24
 2013-07-01 00:00:00 | iPhone 4S  | 0.19
 2013-07-01 00:00:00 | iPhone 5   | 0.16
 2013-07-01 00:00:00 | iPad 3     | 0.09
 2013-07-01 00:00:00 | iPad 4     | 0.07
 2013-07-01 00:00:00 | iPad Mini  | 0.04
 2013-07-01 00:00:00 | iPhone 3GS | 0.00
 2013-07-01 00:00:00 | iPad 1G    | 0.00

Filed under: Game Design, Software Development

There Is No Excuse For Bad Programming

I’d like to take a moment to discuss a common problem in software development. It comes up everywhere. That problem is the problem of what to do. No really, hear me out on this. Suppose we want to get a value based on the input of a function. We might build a function that looks like this:

def if_block_func(v):
if v == 'some string1': x = 1
elif v == 'some string2': x = 2
elif v == 'some string3': x = 3
elif v == 'some string4': x = 4
elif v == 'some string5': x = 5
elif v == 'some string6': x = 6
elif v == 'some string7': x = 7
else: x = 8

return x

Of course, our piece of code works and it’s relatively fast. However, it’s kinda ugly and painful to maintain. I’m pretty sure we can come up with a more maintainable piece of code, even if it’s slightly slower. Seeing as how we’re using Python for this example, we might come up with something clever like this:


def recreate_dict_func(v):
d = {
'some string1' : 1,
'some string2' : 2,
'some string3' : 3,
'some string4' : 4,
'some string5' : 5,
'some string6' : 6,
'some string7' : 7,
}
return d.get(v, 8)

Of course, this only works if there’s really simple requirements and a single value is a single value. What if we needed something slightly more complicated? Maybe the return value for ‘some string4’ depends on several other variables. Well, that’s certainly a lot stronger case for if/else. However, we might be able to adjust the dictionary based approach by doing something more clever like this:


def recreate_lambda_dict_func(v):
dl = {
'some string1' : lambda: 1,
'some string2' : lambda: 2,
'some string3' : lambda: 3,
'some string4' : lambda: 10 if random.choice(range(5)) % 3 == 0 else 4,
'some string5' : lambda: 5,
'some string6' : lambda: 6,
'some string7' : lambda: 7,
}
return dl.get(v, lambda: 8)()

Of course, the penalty of working in a higher level language is generally a performance penalty, and it’s pretty easy to put together a benchmark that shows that penalty here. However, sometimes programmer time might be worth that penalty. But sometimes it may not be. Maybe there’s a way we could improve these functions to be even faster? Maybe if we instantiated less objects the method would be faster.


external_dict = {
'some string1' : 1,
'some string2' : 2,
'some string3' : 3,
'some string4' : 4,
'some string5' : 5,
'some string6' : 6,
'some string7' : 7,
}
def external_dict_func(v):
global external_dict
return external_dict.get(v, 8)

external_lambda_dict = {
‘some string1’ : lambda: 1,
‘some string2’ : lambda: 2,
‘some string3’ : lambda: 3,
‘some string4’ : lambda: 4,
‘some string5’ : lambda: 5,
‘some string6’ : lambda: 6,
‘some string7’ : lambda: 7,
}

def external_lambda_dict_func(v):
global external_lambda_dict
return external_lambda_dict.get(v, lambda: 8)()

So let’s put together this benchmark that shows how bad the performance penalty is. However to keep things on the even, let’s just have the lambda function always return 4 (just because the rest of the code exhibits that behavior). Let’s throw a @benchmark decorator on those methods and run this. So here’s the results:


~ $ python dict_vs_ifs.py
+---------------------------+--------------+---------+
| Function | Sum Duration | Calls |
+===========================+==============+=========+
| external_dict_func | 0.541 | 1000000 |
+---------------------------+--------------+---------+
| if_block_func | 0.682 | 1000000 |
+---------------------------+--------------+---------+
| external_lambda_dict_func | 0.727 | 1000000 |
+---------------------------+--------------+---------+
| recreate_dict_func | 1.258 | 1000000 |
+---------------------------+--------------+---------+
| recreate_lambda_dict_func | 1.746 | 1000000 |
+---------------------------+--------------+---------+

Ok, that’s pretty interesting. The external dictionary function is actually the fastest (almost 25% faster!) – while being the most maintainable. That’s absolutely wild. I know, I know – you’re going to tell me that this doesn’t represent “the real world”. After all, we’re frequently working with classes and you’ve got to do the instance dereference to get the dictionary and .. ok. Sure. Let’s modify the code such that we have that layer of dereferencing. It’s certain to add some complexity and maybe our naive if/else block will be the most performant option again. While we’re at it, we can run a variant where the variable we’re switching on is an instance variable.

Class attribute lookups

Benchmark Results
+---------------------------+--------------+---------+
| Function | Sum Duration | Calls |
+===========================+==============+=========+
| external_dict_func | 0.609 | 1000000 |
+---------------------------+--------------+---------+
| if_block_func | 0.707 | 1000000 |
+---------------------------+--------------+---------+
| external_lambda_dict_func | 0.807 | 1000000 |
+---------------------------+--------------+---------+
| recreate_dict_func | 1.314 | 1000000 |
+---------------------------+--------------+---------+
| recreate_lambda_dict_func | 1.749 | 1000000 |
+---------------------------+--------------+---------+

Instance Variable

Benchmark Results
+---------------------------+--------------+---------+
| Function | Sum Duration | Calls |
+===========================+==============+=========+
| external_dict_func | 0.645 | 1000000 |
+---------------------------+--------------+---------+
| if_block_func | 0.851 | 1000000 |
+---------------------------+--------------+---------+
| external_lambda_dict_func | 0.854 | 1000000 |
+---------------------------+--------------+---------+
| recreate_dict_func | 1.342 | 1000000 |
+---------------------------+--------------+---------+
| recreate_lambda_dict_func | 1.821 | 1000000 |
+---------------------------+--------------+---------+

As we can see, the dictionary based approach continues to simultaneously excel at both readability and performance. As situations come closer to real life, the lambda approach begins to also look better than if/else blocks. Basically, there is no excuse for writing bad code.

Note: I apologize for the shitty code formatting.  Wordpress has deleted like 12 times and I’m done fighting it.  Maybe tomorrow.

Filed under: Software Development,

Quick And Dirty Job Queue

I’ve been a busy developer for the last little while. I’ve put out a game analytics stack that (AFAIK) rivals the features of every commercially available solution in the gaming space. Along the way I’ve been trying to follow an agile development approach of rapid development and deployment, and make sure that the features get out in front of the stakeholders as they are completed.

Of course, that means that the path to get here hasn’t necessarily been terribly smooth, and it’s been filled with a great many late nights. A lot of those late nights and weekends have been centered around making development deadlines, but almost all of the really late nights have been for deployments or devops purposes.  Which brings me to the focus of why I’m writing this blog post.

One of the things I do for a living is throw data around.  Not just data, but lots of data – and lots of kinds of data too.  The data warehouse part of the analytics stack is complicated and there’s lots of runners pushing data all over the place.  Believe it or not, cron has actually been sufficient so far for our job scheduling needs.  At some point I expect that I’ll have to move to something like Oozie – or maybe just skip it entirely and head straight for the Storm (this seems more my speed anyway).

Over time, I’ve added features like parallel importing, parallel summaries, more summaries, and so so much more.  One of the ongoing (many) battles I’ve been facing is the memory footprint of unique and percentile calculations.  Combining breakneck feature development with billions of events and millions in row cardinality has driven the deployments to be multi day affairs and devops to take up an increasingly large amount of my time.

With that in mind, I’d like to impart to you a cool quick and dirty job queue manager.  For my particular purposes it lets my batch processing platform operate quite a bit like a data stream or message passing processor – without overloading the (meager) processing resources available.  First, let me state that I have long been a fan of xargs and it makes a daily appearance in my shell.  However, it has several critical failings for this purpose:

  • Untrapped application deaths can “permanently” lower your processing throughput rate
  • You can’t add tasks to the input list once things are underway
  • You can’t remove tasks from the input list once things are underway
  • It doesn’t realistically scale into crontab

With these limitations in mind, I set out to find a way to improve my current crontab based solution in some key areas:

  • We must not overload the processing resources by firing off too many processes
  • The processes must restart quickly when data is available to be processed
  • I don’t want to hear about it when a process fails because there’s nothing to do (flock based solutions)
  • I do want to hear about it when there’s error output to be had
  • Ideally, this would scale across machines on the cloud

A crontab styled on the following was the outcome of my search – and it fulfills all the requirements.  The magic happens in several parts.  First, the command “sem” is an alias for (GNU) parallel –semaphore.  It’s not available on ubuntu (coreutils/moreutils parallel is different), so you’ll need to install it manually (see below).  Let’s examine this part of the command: “sem –id proc -j2 ImportProcess”.  This checks the “proc” counting semaphore and fires off a non-blocking ImportProcess if there are less than two objects using that semaphore.  If there are 2+, it will block.

At a glance, that’s exactly what I want.  It won’t run if there’s already N of them running, but it will just sit there.  The requests will pile up and slow everything down.  I looked at the arguments available in parallel and sem naturally, but none of them seemed to do what I want.  sem –timeout claims to simply force-fire the process after a time and parallel –timeout kills the process if it’s still running after a certain amount of time.  What I wanted was to have the process only wait for the mutex for so long.

My first thought was that I could use timeout to accomplish this, but as it turns out parallel ignores SIGTERM and continues to wait.  However, timelimit -qs9 sends a kill -9 to the blocking sem request.  It’s ugly, but effective and works.  The final piece of the puzzle would be to swallow the death of timelimit.  That’s where “|| true” comes in.  As with all things, there’s a limit to how cool this particular piece of code is – I also lose notications of the OS killing my application (for example, it runs out of memory).  I’ll work on that later, probably by adding a patch to parallel’s many, many, many, many options.

MAILTO=your_email@your_domain.com
*/1 * * * * timelimit -qs9 -t1 /usr/local/bin/sem --id proc -j2 ImportProcess || true
*/1 * * * * timelimit -qs9 -t1 /usr/local/bin/sem --id proc -j5 TransformProcess || true
*/1 * * * * timelimit -qs9 -t1 /usr/local/bin/sem --id proc -j7 SummaryProcess || true

Installing GNU Parallel:

wget http://ftp.gnu.org/gnu/parallel/parallel-20130222.tar.bz2
tar jxf parallel-20130222.tar.bz2
cd parallel-20130222/
./configure
make
sudo make install
which parallel # Make sure this says /usr/local/bin instead of /usr/bin

Filed under: Data Warehousing, Software Development

Primitive Class Variables in Python

I recently ran across something peculiar in my Python development.  I was writing some builders for complex JSON objects and decided to move away from random.randint and simply use a class variable.  I had some code that looked something like this:

class FooBuilder(object):
    def __init__(self, **kwargs):
        options = {
            "obj_id" : random.randint(1, 10000000),
        }

        options.update(kwargs)

I know, it’s not a great design and I could expect some failures due to random number collisions. It was also a bit slower than I really wanted, so I modified it to look like this:

class FooBuilder(object):
    next_obj_id = 0
    def __init__(self, **kwargs):
        options = {
            "obj_id" : self.next_obj_id,
        }

        options.update(kwargs)    
        self.next_obj_id += 1

However, it had a peculiar property: all my tests failed because it appeared that the class variable never updated. I did some experimenting and found lists, dictionaries, and pretty much everything but ‘native’ types worked exactly as expected. It turns out that what’s happening is that you’re assigning the incremented primitive int to the instance because it’s literally a new object. In order to assign it back to the class you have to take some special precautions – type(self).next_obj_id += 1. Here’s some sample code that demonstrates what I’m talking about:

import random

class Foo(object):
    def __init__(self, **kwargs):
        options = {
            "obj_id" : random.randint(1, 10000)
        }

        self.data = options
        print "Foo." + str(self.data)

class Bar(object):
    next_obj_id = 0

    def __init__(self, **kwargs):
        options = {
            "obj_id" : self.next_obj_id
        }

        self.next_obj_id += 1

        self.data = options
        print "Bar." + str(self.data)

class Working(object):
    next_obj_id = 0

    def __init__(self, **kwargs):
        options = {
            "obj_id" : self.next_obj_id
        }

        type(self).next_obj_id += 1

        self.data = options
        print "Working." + str(self.data)

Foo()
Foo()
Foo()

Bar()
Bar()
Bar()

Working()
Working()
Working()

It outputs:

Foo.{‘obj_id’: 1234}
Foo.{‘obj_id’: 40}
Foo.{‘obj_id’: 2770}
Bar.{‘obj_id’: 0}
Bar.{‘obj_id’: 0}
Bar.{‘obj_id’: 0}
Working.{‘obj_id’: 0}
Working.{‘obj_id’: 1}
Working.{‘obj_id’: 2}

tl;dr:
type(self).class_variable_name or self.__class__.class_variable_name to modify class variables seems to be a better choice than self.class_variable.

Filed under: Software Development, ,

Pessimistic vs Optimistic Memoization

def memoize(obj):
    cache = obj.cache = {}

    @functools.wraps(obj)
    def memoizer(*args, **kwargs):
        if args not in cache:
            cache[args] = obj(*args, **kwargs)
        return cache[args]
    return memoizer

I think one of the first things that anyone does with a dynamic language is write a memoizer to save time on expensive calculations. This is the memoizer from http://wiki.python.org/moin/PythonDecoratorLibrary. I like this one because it exposes the cache for clearing – an important feature in tests. This can be accomplished by creating a list of memoized functions and manually resetting their cache. The actual cache reset looks something like this:

@memoize
def method_name(some_arg):
    return some_arg + 1

method_name.cache = {}

However, I think there’s several things we should know about this particular decorator before just using it:

  • It does not properly account for **kwargs. The thing to remember here is that **kwargs is implicitly a dictionary – an unhashable object. There are several popular methods of hashing a dictionary, but the far and away most popular appears to be hashing on frozenset(dict.items()). Another much less popular way is tuple(zip(dict)). We’ll do some testing to determine which is superior. One important thing to remember here is that large amounts of kwargs and long variable names can lead to quite a performance penalty no matter which one is ultimately better.
  • It does not properly handle unhashable or nested arguments. I think this is probably an acceptable limitation because solving it imposes a large penalty on both code performance and code maintainability. I think it is imperative to have a proper test suite to ensure that @memoized methods are not passed unhashable or nested arguments.
  • There appears to be two competing ways to do caching in Python. The first is the Look Before You Leap approach that conventional wisdom dictates, and is the one used here. Some cursory thought on the matter tells me that a more optimistic method of handling cache hits with try/except might work better. We’ll do some testing to determine which is superior.

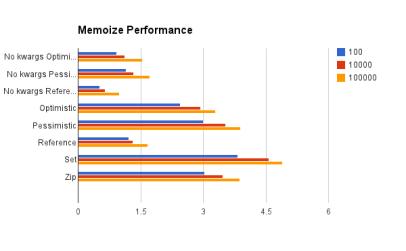
Each caching strategy was tested over a list of 1 million tuples and utilize kwargs.  The numbers in the legend represent the basic cardinality of the unique values in the tested list.  The cache hit rate can be found by dividing the cardinality by 1 million.  Each memoization strategy was tested 20 times and the test results here are the average. I think that a picture is worth a thouand words, and so I’ve included a pretty graph. However, I’ve also included the base data below.

I think there should be several take aways from this:

  • tuple(zip(dict)) is superior to frozenset(dict.items())
  • Optimistic caching (try/except) is generally superior Look Before You Leap (key in cache)
  • There is a noticeable performance penalty for caching on kwargs. It might be worth having several memoize annotations and using the most appropriate one.
  • Lots of **kwargs with long names causes a major performance penalty

This is the final version of the memoizer (many thanks to Bryce Drennan in the comments for catching a bug in the memoizer):

def memoize(obj):
    cache = obj.cache = {}

    @functools.wraps(obj)
    def memoizer(*args, **kwargs):
        key = (args, tuple(zip(kwargs.iteritems())))
        try:
            return cache[key]
        except KeyError, e:
            value = obj(*args, **kwargs)
            cache[key] = value
            return value
    return memoizer

This is the previous version of the memoizer:

def memoize(obj):
    cache = obj.cache = {}

    @functools.wraps(obj)
    def memoizer(*args, **kwargs):
        key = (args, tuple(zip(kwargs)))
        try:
            return cache[key]
        except KeyError, e:
            cache[key] = value = obj(*args, **kwargs)
            return value
    return memoizer

Raw data

Tiny (Iterations: 1000000, Cardinality: 100)

  • Reference : 1.2129
  • Set : 3.8267
  • Zip : 3.0283
  • Pessimistic : 3.0055
  • Optimistic : 2.4478
  • No kwargs Reference : 0.5133
  • No kwargs Pessimistic : 1.1473
  • No kwargs Optimistic : 0.9309

Low (Iterations: 1000000, Cardinality: 10000)

  • Reference : 1.3167
  • Set : 4.5701
  • Zip : 3.4687
  • Pessimistic : 3.5359
  • Optimistic : 2.9393
  • No kwargs Reference : 0.6553
  • No kwargs Pessimistic : 1.3239
  • No kwargs Optimistic : 1.1201

Med (Iterations: 1000000, Cardinality: 99995)

  • Reference : 1.6757
  • Set : 4.9049
  • Zip : 3.8719
  • Pessimistic : 3.8955
  • Optimistic : 3.2962
  • No kwargs Reference : 0.9838
  • No kwargs Pessimistic : 1.7194
  • No kwargs Optimistic : 1.5371

Filed under: Software Development, , ,

Finding Unused Functions in a Python Source Tree

So for the last few months I have been crunching up a storm on getting the analytics out the door for our latest game.  I just finished some cool new features and had to do some major refactors (one step at a time, of course).  I began to suspect that I’d left some stray code hanging out there that wasn’t being used anymore.  I figured a great way to solve the problem was by looking at each function and grepping the source tree to see if it existed anywhere else.  First, let me introduce you to ack-grep [betterthangrep.com] (aliased as ‘ack’ below).  The best thing about ack-grep is that it lets you filter out certain file types from your results – and despite being written in Perl it’s frequently much faster than grep.

Now I’ll go over the evolution of a shell command.  Some of the steps are injected here because I knew where I was going – but for your benefit I’ll explain how things evolved.  The code base in question is about 10k lines over 140 files.

$ ack ‘def’

… bunch of functions and a bunch of other stuff …

$ ack ‘ def ‘

… function definitions …

Now let’s get the function name itself.  It should look like ‘def “function name”(arguments):’ so the first order of business is to cook up a regular expression to filter the line.  I’m better with Perl than with Sed, so I did it like this:

$ ack ‘def ‘ | perl -pe ‘s/.*def (\w+)\(.*/\1/’

I scrolled through looking for any obvious errors but didn’t find any.  Now comes the magic sauce.  xargs -I{} creates a new command for every input line and inserts the input row where {} exists.  Basically, this created a for each loop in shell.

$ ack ‘def ‘ | perl -pe ‘s/.*def (\w+)\(.*/\1/’ | xargs -I{} bash -c ‘ack “{}”‘

One thing I saw was that function usages were being attributed to functions that *contained* their name.

$ ack ‘def ‘ | perl -pe ‘s/.*def (\w+)\(.*/\1/’ | xargs -I{} bash -c ‘ack “\b{}\b”‘

That’s better, but functions that are defined multiple times (like __init__) are coming up a lot…

 $ ack ‘def ‘ | perl -pe ‘s/.*def (\w+)\(.*/\1/’ | sort | uniq | xargs -I{} bash -c ‘ack “\b{}\b”‘

Ok, but now the text is just flying by so fast and some functions are used hundreds of times and others very few…

$ ack ‘def ‘ | perl -pe ‘s/.*def (\w+)\(.*/\1/’ | sort | uniq | xargs -I{} bash -c ‘ack “\b{}\b” | wc -l’

Ok, now I know how many times something appears but not what it is…

$ ack ‘def ‘ | perl -pe ‘s/.*def (\w+)\(.*/\1/’ | sort | uniq | xargs -I{} bash -c ‘echo {} && ack “\b{}\b” | wc -l’

Ok, that’s great.  Now I have the name of the function and how many times that name appears in the source tree.  It’s kinda unwieldy though because the name is on a different line than the count and I can’t use grep.

$ ack ‘def ‘ | perl -pe ‘s/.*def (\w+)\(.*/\1/’ | sort | uniq | xargs -I{} bash -c ‘echo -n {} && ack “\b{}\b” | wc -l’

Fantastic.  Now I can look at just the functions that rarely get used!  Oh look, there’s so many tests coming up… :-/

$ ack ‘def ‘ | perl -pe ‘s/.*def (\w+)\(.*/\1/’ | sort | uniq | xargs -I{} bash -c ‘echo -n {} && ack “\b{}\b” | wc -l’ | egrep -v ‘^test_’

Ok, now let’s limit it to things appearing once…

$ ack ‘def ‘ | perl -pe ‘s/.*def (\w+)\(.*/\1/’ | sort | uniq | xargs -I{} bash -c ‘echo -n {} && ack “\b{}\b” | wc -l’ | egrep -v ‘^test_’ | egrep ‘ 1$’

Fantastic.  That’s exactly what I was looking for.

Filed under: Software Development, , ,

Python JSON Performance

So I’ve been pretty open about the fact that I’ve moved from data warehousing in the television and online ad industries to data warehousing in the gaming industry. The problem domains are so incredibly different. In the television and ad industries, there’s a relatively small amount of data that people are actually concerned about. Generally speaking, those industries are most interested in how many people saw something (viewed the ad), how many people interacted with it (clicked on it), and whether they went on to perform some other action (like buying a product).

However, in the gaming industry we’re interested in literally everything that a user does – and not in the creepy way. The primary goals are to monitor and improve user engagement, user enjoyment, and core business KPIs.  There are a lot of specific points to focus on and try to gather this information, and right now the industry standard appears to be a highly generalized event/payload system.

When looking at highly successful games like Temple Run (7M DAU [gamesbrief]) it’s only 150 events per user to get a billion events per day.  Between user segmentation and calculating different metrics it’s pretty easy to see why you’d have to process parts of the data enough times that you’re processing trillions of events and hundreds of GB of facts per day.

When I see something that looks that outrageous, I tend to ask myself whether that’s really the problem to be solving. The obvious answer is to gather less data but that’s exactly the opposite of what’s really needed. So is there a way that to get the needed answers without processing trillions of events per day? Yes I’d say that there is; but perhaps not with the highly generic uncorrelated event/payload system.  Any move in that direction would be moving off into technically uncharted territory – though not wholly uncharted for me. I’ve built a similar system before in another industry, albeit with much simpler data.

If you aren’t familiar at all with data warehousing, a ten thousand foot overview (slightly adapted for use in gaming) would look something like this.  First, the gaming client determines what are interesting facts to collect about user behavior and game performance. Then it transmit JSON events back to a server for logging and processing.  From there the data is generally batch processed and uploaded to a database* for viewing.

So as a basic sanity check, I’m doing some load testing to determine whether it is feasible to gather and process much higher resolution information about a massively successful game and it’s users than seems to be currently available in the industry.  Without going into proprietary details, I’ve manufactured analytics for a fake totalhelldeath game.  It marries Temple Run’s peak performance with a complicated economy resembling Eve Online’s.

From there, I’m compressing days of playtime into minutes and expanding the user base to be everyone with a registered credit card in the app store (~400M people as of 2012) [wikipedia].  The goal here is to see how far it’s possible to reasonably push an analytics platform in terms of metrics collection, processing, and reporting.  My best estimate for the amount of data to be processed per day in this load test is ~365 GB/day of uncompressed JSON.  While there’s still a lot that’s up in the air about this, I can share how dramatically the design requirements differ:

Previously:

  • Reporting Platform: Custom reporting layer querying 12TB PostgreSQL reporting databases
  • Hardware: Bare metal processing cluster with bare metal databases
  • Input Data: ~51GB/day uncompressed binary (~150TB total uncompressed data store)
  • Processing throughput: 86.4 billion facts/day across 40 cores (1M facts/sec)

Analytics Load Test:

  • Reporting Platform: Reporting databases with generic reporting tool
  • Hardware: Amazon Instances
  • Input Data: ~365 GB/day uncompressed JSON (~40k per “hell fact” – detailed below)
  • Processing throughput: duplication factor * 8.5M facts/game day (100 * duplication facts/sec)

I’ve traditionally worked in a small team on products that have been established for years.  I have to admit that it’s a very different experience to be tasked with building literally everything from the ground up – from largely deciding what analytics points are reasonable to collect to building the system to extract and process it all. Furthermore, I don’t have years to put a perfect system into place, and I’m only one guy trying to one up the work of an entire industry.  The speed that I can develop at is critical: so maintaining Agile practices [wikipedia], successful iterations [wikipedia], and even the language I choose to develop in is of critical importance.

The primary motivator for my language choice was a combination of how quickly I can crank out high quality code and how well that code will perform.  Thus, my earlier blog post [blog] on language performance played a pretty significant role in which languages saw a prototype.  Python (and pypy specifically) seems well suited for the job and it’s the direction I’m moving forward with.  For now I’m building the simplest thing that could possibly work and hoping that the Pypy JIT will alleviate any immediate performance shortfalls.  And while I know that a JIT is basically a black box and you can’t guarantee performance, the problem space showed high suitability to JIT in the prototyping phase.  I foresee absolutely no problems handling the analytics for a 1M DAU game with Python – certainly not at the data resolution the industry is currently collecting.

But, I’m always on the look out for obvious performance bottlenecks.  That’s why I noticed something peculiar when I was building out some sample data a couple of days ago. On the previous project I worked on, I found that gzipping the output files in memory before writing to disk actually provided a large performance benefit because it wrote 10x less data to disk.  This shifted our application from being IO bound to being CPU bound and increased the throughput by several hundred percent.  I expected this to be even more true in a system attempting to process ~365GB of JSON per day, so I was quite surprised to find that enabling in-memory gzip cut overall application performance in half.  The implication here is that the application is already CPU bound.

It didn’t take much time before I’d narrowed down the primary culprit: json serialization in pypy was just painfully slow. It was a little bit surprising considering this page [pypy.org] cites pypy’s superior json performance over cpython.  Pypy is still a net win despite the poor JSON serialization performance, but the win isn’t nearly as big as I’d like it to be. So after a bit of research I found several json libraries to test and had several ideas for how the project was going to fall out from here:

  • Use a different json library. Ideally it JITs better than built in and I can just keep going.
  • Accept pypy’s slow json serialization as a cost of (much) faster aggregation.
  • Accept cpython’s slower aggregation and optimize aggregation with Cython or a C extension later
  • Abandon JSON altogether and go with a different object serialization method (protobuf? xdr?)

After some consideration, I ruled out the idea of abandoning JSON altogether. By using JSON, I’m (potentially) able to import individual records at any level into a Mongo cluster and perform ad hoc queries. This is a very non-trivial benefit to just throw away! I looked at trying many JSON libraries, but ultimately settled on these three for various reasons (mostly relating to them working):

To test each of these libraries, I devised a simple test with the goal of having the modules serialize mock event data.  This is important because many benchmarks I’ve seen are built around very small contrived json structures.  I came up with the following devious plan in order to make sure that my code couldn’t really muck up the benhmark results:

  • create JSON encodable dummy totalhelldeath fact list
  • foreach module: dump list to file (module.dump(facts, fp))
  • foreach module: read list from file (facts = module.load(fp))

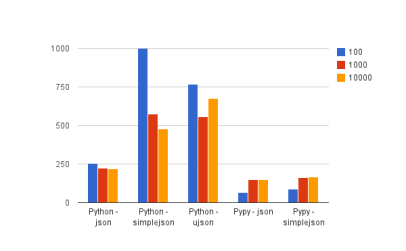
Just so that everything is immediately obvious: this was run on one core of an Amazon XL instance, and the charts are measuring facts serialized per second.  That means that bigger bars are better here.

Read Performance

There’s really no obvious stand out winner here, but it’s obvious that the builtin json library is lacking in both cpython and pypy. It obviously runs a bit faster with cpython, but it’s not enough to really write home about. However, simplejson and ujson really show that their performance is worth it. In my not-so-expert opinion, I’d say that ujson walks away with a slight victory here.

Write Performance

However, here there is an obvious standout winner. And in fact, the margin of victory is so large that I feel I’d be remiss if I didn’t say I checked file sizes to ensure it was actually serializing what I thought it was! There was a smallish file size difference (~8%), primarily coming from the fact that ujson serializes compact by default.

So now I’m left with a conundrum: ujson performance is mighty swell, and that can directly translate to dollars saved.  In this totalhelldeath situation, I could be sacrificing as much as 71k + 44k extra core-seconds per day by choosing Pypy over CPython.  In relative money terms, that means it effectively increases the cost of an Amazon XL instance by a third.  In absolute terms, it costs somewhere between $5.50 USD/day and $16 USD/day – depending on whether or not it’s necessary to spin up an extra instance or not.

Obviously food for thought. Obviously this load test isn’t going to finish by itself, so I’m putting Python’s (lack of) JSON performance behind me.  But the stand out performance from ujson’s write speed does mean that I’m going to be paying a lot closer attention to whether or not I should be pushing towards CPython, Cython, and Numpy instead of Pypy.  In the end I may have no choice but to ditch Pypy altogether – something that would make me a sad panda indeed.

Filed under: Data Warehousing, Game Design, Personal Life, Software Development

CSM Minutes: Misleading

Let me begin with a quote from the CSM minutes:

CCP Greyscale moves on to explain his work on sentry guns. Sentry guns will now shoot anyone with a criminal flag, suspect or otherwise. Sentry guns will also start with smaller amounts of damage, and ramp up with time. Ideal tuning will be to where triage carriers will die at around 4 1/2 minutes. This way, if you want to use triage carriers in lowsec on gates you can, but you must commit to the cycle for a length of time before starting your reps, if you want to deactivate triage before the sentry guns kill you and jump out. CCP Greyscale also points out that another goal is to make it so that the first couple of hits won’t kill an interceptor immediately, enabling a quick tackle, and then a warp out.

Aleks remarks that this would be great for enabling more frigate use in lowsec piracy.
Aleks asks when all of these changes will be released, and when there will be dev blogs released for this information.
CCP Masterplan explains that this is where everything is at in the design process, that they’re looking forward to working more on this as the Inferno stuff dies down.
CCP Soundwave: “It is looking like a December release.”
Aleks and CCP Greyscale briefly discuss community response to these changes, Greyscale acknowledges that the changes to “suspect” flagging would upset some players, particularly canflippers.

I want to be clear that presentation of this section of the CSM minutes is very different from this following section, which is clearly a brain storm:

On the subject of sniping, Greyscale tossed out a high-level idea for a fix to sniping. He asked for CSM input on one such idea, an interdiction probe that would be launched a certain range before the bubble would deploy. In essence it would work as a drag-bubble to protect the sniping fleet, or at least give it ample time to react and reposition.
Elise was receptive to the idea and added that the biggest hindrance to sniping is the speed of ongrid probing.
Seleene and UAxDEATH agreed strongly.
CCP Soundwave chimed in with an idea of putting probes on grid and making them destructible. He argued that it would give small support a more pronounced role.
UAxDEATH was very receptive to the idea of giving support a stronger role.
Two step spitballed some ideas where probing would become less accurate with more results, and another idea where there was a probe-killing-probe.

The rage was further fanned on by certain CSM members who seemed to be all but directly confirming that it was already in development and would be hitting TQ in a form very like it was presented in the CSM minutes.   The problem got worse when many other CSM members refused to clarify that section of the minutes or actively defended it.  There were many suggestions by both the CSM and CCP to post on the forums – because obviously this is a good place to hold a discussion.  The only official answer was “It isn’t final until it’s on TQ”, a phrase that’s preceded a great many things that have in fact made their way to TQ.  It truly surprises me that the CSM feels that the community “jumped the shark” and was unreasonably angry given the presentation we were given about what was said.

However, after much discussion with various CSM members via blog post comments, forum posts, twitter, and Skype… I have to say that I’m pretty sure that the CSM minutes probably did not reflect the spirit of what was said at the CSM summit.  Both Hans Jagerblitzen and Seleene specifically said they’d not support any changes with ramifications so broadly destructive to PVP in low sec.  Hans even went back and watched the video and says that the context surrounding the fact it was brain storming was simply not put in the CSM minutes.

And as a final recap, here is a sample of the enormous list of problems with what was represented in the CSM minutes:

  • Gate camping is a hallmark of PVP in Eve because travel chokepoints are where you are going to find people.  This is true in high sec, low sec, null sec, and WH space.  Why should low sec suddenly become very different without core game mechanics changes that support that change across all of Eve?
  • Any sentry fire that was heavy enough to kill triage carriers at 4.5 minutes would be dealing somewhere between 35k and 150k DPS – obviously much more than any subcap can work around.  This means that the overall implication is that most non-gank subcap fights would also end up with everyone just getting blapped by the sentries.  Gate camping and ganks would still be possible via ninja camping and sniping, but real PVP fights would simply become untenable to have on a low sec gate.
  • The suggestion allows for gate camping with triple sensor boosted stilettos.  While it won’t materially change my own travel through low sec, this would make travel for non-flashy people much more dangerous – ostensibly something that we’re trying to avoid.
  • The suggestion does nothing for the core reasons why low sec is an underutilized area of space.  Provably, gate camps were never the problem – after all, we can look to null sec with it’s perma bubble camps to know better.  It’s must be a risk vs reward thing.

So obviously the suggestion itself is not fully thought out because of it’s ramifications for PVP in low sec, so let’s come up with something that sounds reasonable.  From everything I can gather, these are the primary motivations:

  • Get more people in to low sec
  • Allow different kinds of engagements on gates (eg, frigates)
  • Prevent perma camps
  • Prevent capital camps
  • Prevent orca camps?
  • Prevent blob camps?

For the sake of full disclosure, here’s what I personally think of each:

  • More people in low sec is great, but I don’t care so much about carebears coming to low sec.  They will never leave the relative safety of High and Null sec for the much more dangerous waters of Low sec – and that’s perfectly fine.  Give me your casual and small gang PVPers instead – all of them you can round up. 🙂
  • I’m kinda -1 to letting frigs engage under sentry fire.  On the one hand it’d be cool, but on the other it makes travel through low sec much more dangerous for carebears.
  • While I don’t tend to gate camp (it’s boring), I see absolutely no problem with perma camps.  I feel like places like Amamake and Rancer provide interesting geography and places of legend.  I see this as literally no different than the perpetual camps in PF- and M-O and other null sec entry systems.
  • I see absolutely no problem with capital camps.  I feel like low sec tends to small gang PVP and dropping a triage carrier or two is a pretty big signal there’s about to be an epic fight.  Well, it would be if you weren’t about to have PL drop a few hundred supercaps on you anyway.
  • Yeah, nerf the shit out of Orca/Carrier stowing under aggression.
  • I’m not a big fan of blob camping, but it’s allowed in every other area of space.  I see no reason why it shouldn’t be allowed in low sec too.

If the goal is to allow more types of PVP in low sec, I’d say that the first thing that should be done is just remove sentries entirely.  The key distinction between NPC null sec and Low sec would be the lack of bubbles, bombs, and certain supercapital features.  It’d mean that people no longer hesitated to pull the trigger on who would aggress because there would be no sentry fire to worry about.  There are a number of really good things about this approach – however it’d also kill the “heavier ship” fighting style that only blooms in low sec.

If the goal is to get more carebears into low sec, I think we’re looking entirely in the wrong direction.  The simple fact of the matter is that anyone that can stomach any risk at all is already in null sec – where the best rewards are.  There’s no reason for anyone to go to low sec for carebear rewards, ever.  So the first thing to do would be to provide that.  Then we should keep sentry guns or perhaps buff them a bit (with the added “benefit” of further encouraging the heavier ship doctrines I mentioned earlier).  Even if we neglected the fact that most established pirate corps have dozens of max skill scan prober alts, the instalocking frigs would simply be the doom of high sec carebears coming to low sec for PVE.

If the goal is to nerf Orca/Carrier stowing, then simply prevent stowing when you could not jump through a gate (eg, you are aggressed).  You could also transfer aggression to the Orca.

If the goal is to nerf capital camps and encourage frigate PVP under gate fire, I’d say the right answer is to turn sentry guns into missile batteries firing relatively slow missiles.  This means that you can scale damage by sig radius and speed, so capitals are getting hit by a dread while frigs and fast cruisers are getting tickled.  I hesitate to point it out, but it could also be used as a mechanism for ramping up the damage and would provide a visual indicator of how angry the sentry guns are becoming – warp out or die when this Ball O Rage hits you.

One thing I know for sure is that I am not a game designer and don’t really want to be one.  But, I will do everything in my power to help the game move in a direction that’s a bit more friendly to everyone without simply deleting my play style.

Filed under: Eve, Gaming